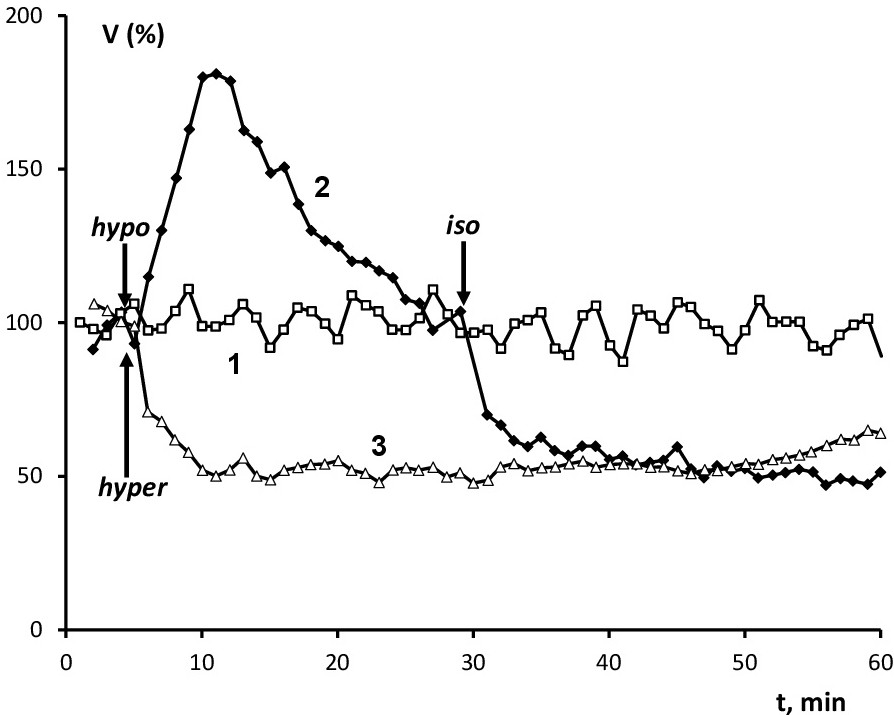
Fig. 1. Time-course of volume changes in HUVEC during 1 hr incubation in control cells (1) and in cell subjected to isosmotic (2) or hyperosmotic (3) shrinkage. Arrows indicate time when cells were exposed to hyposmotic (hypo), isosmotic (iso) and hyperosmotic (hyper) media as described in the Methods section. Initial cell volume values (V) were considered as 100%. Means for 4 independent experiments are shown.